SharePoint Designer offers the possibility to create datasource which can be linked in order to display a merged or combined view of the data sources. It’s a pretty cool function in order to create list views – but it was more comfortable with the SharePoint Designer with Preview. Anyway, this post covers a small example of those linked data source.
So in this post i want to give an example of how to deal with that. In creation time, we will come a point where the following question has to be answered that’s why i put it first;
Merge or Join?
Using linked data sources gives you two options: Merging or joining. But what is the difference? You should read this great post.
A merge is an interesting thing if your data sources have exactly the same columns – so you can sort, order or group on the data.
A join is useful if your lists or data sources are completely different but they have one column to combine (like Product ID) at least.
Well, after that let’s do some work. Let’s think about an easy scenario. Ok, we have two tasks lists. We want to see all tasks from both lists.
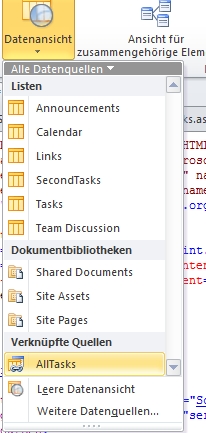
Step 1: Create a Datasource
At first we open SharePoint Designer an click on datasources. There we click on linked data source button and choose the lists we wanna linking, and their field afterwords. Give the datasource a cool name. By the way i choose join.

That’s our datasource.
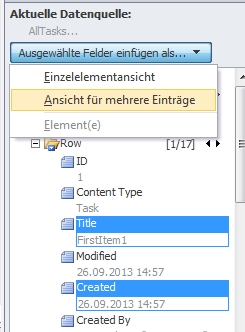
Step 2: Create a Page
Now we go to site pages and create an aspx page. Between the formtag we add a dataview from our newly created data source.
After it has been created we delete the dataform webpart. In the right pane there is our data source. We choose the columns we want to have and add it as multiple items.
Now we have a list with our data. But we are not ready yet. We would like to make it a bit beautiful.
Step 3: Modify your list
Now you can do everything with XSLT to format your datalist. I did the following:
- Add a column which indicates from which lists the data comes from
- Format the field assigned to and editor
- Format the field percent complete
- Add Link to item at Title field
But you can also group or filter your data based on status or any other column.
Step 4: The result
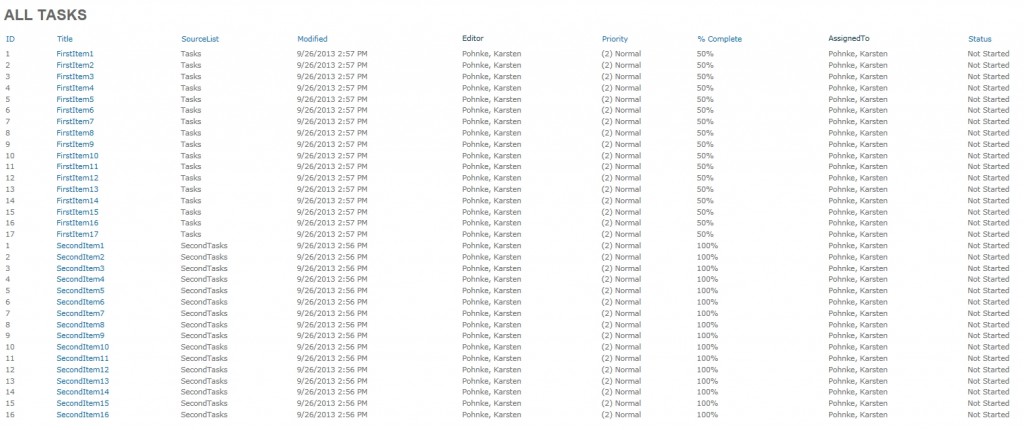
That’s it. Quite easy right? As you can see (if you enlarge the image) the data comes from both lists.
..:: I LIKE SHAREPOINT ::..


